There is a “nearsightedness” disease in trading: staring at the 5-minute chart, watching candle after candle flicker by, your mind bouncing up and down with every tiny price wiggle. After a whole day, you’ve either taken almost no trades, or you’ve taken a few but have no idea why you won or lost. Multi-Timeframe Analysis (MTF) is the prescription for that “nearsightedness.” Its core is a single sentence: Use a higher timeframe to decide whether you should trade; use a lower timeframe to decide when to trade. One sets the direction, the other sets the timing.
Why You Need Two Timeframes
Watching only one timeframe is like looking at the world through a single magnifying glass—you get the detail, but you can’t see where that detail sits on the whole map. Stick to the 5-minute chart and you’ll run into a flood of false breakouts, stop hunts, and noise; stick to the daily chart and the direction is clear, but you have no idea when to enter reasonably, and you often chase the high. Both problems share the same root: making decisions on the wrong layer.
MTF is built to solve exactly that. When you toggle between two timeframes, the higher one gives you context—where the market is in its cycle, whether the direction is up, down, or sideways—while the lower one gives you concrete entry points—which candle triggers the signal, where the stop goes. When the two layers work together, every one of your trades gets both a “story” and a “detail” to stand on.
Top-Down: The Iron Rule of Analysis Order
If you remember only one principle of MTF, let it be this: always look at the higher timeframe first. The mistake beginners most often make is flipping to the 5-minute chart, spotting a breakout, getting excited and ready to enter, and only then going to the daily chart to validate—where they discover the signal is going against the larger trend. At that point, they either give up (a waste of time) or force a rationalization (the start of losing money).
The correct sequence is to determine the rules of the game first, then play the specific move. Practically, that means identifying the trend direction, key levels, and market sentiment on the higher timeframe, building a clear bias (bullish, bearish, or neutral), and only then dropping to the lower timeframe to find a specific entry in the direction of that bias. The order sounds obvious, but fewer than half of traders actually follow it—most let the candles in front of them drag them around and forget to look up at the road.
Common Timeframe Combinations
There is no standard answer for picking timeframes, but there is one iron rule: pick a setup and stick with it—at least 30 to 50 trades before considering a change. The table below maps combinations to trader types; beginners should start with “Daily + 1H” or “4H + 15m,” as these two pairings give the highest-quality signals without forcing you to stare at the screen all day.
| Higher Timeframe | Lower Timeframe | Best Suited For |
|---|---|---|
| Weekly | Daily / 4H | Swing trader; one position held 1–4 weeks |
| Daily | 4H / 1H | Short-term swing; one position held 3–10 days |
| Daily | 30m / 15m | Intraday swing; 1–3 trades per day |
| 4H | 30m / 15m | Fast-paced intraday |
| 1H | 15m / 5m | Classic day trading |
| 1H | 5m / 1m | Scalping specialists |
What to Look for on the HTF: Five Practical Signals
Once you’ve picked your timeframe combo, the most important question is what specific signals to hunt for on the HTF. Below are the five most classic and practical HTF signals, each paired with a real-market case study so you can see the methodology land directly on the candles.
Signal 1: Trade With the Trend After an HTF Key-Level Break
Find a clean, repeatedly tested support or resistance level on the daily or 4H chart—this is where large money has been trading. When price breaks it decisively, buyers have taken control and sentiment shifts from “range” to “trend.”
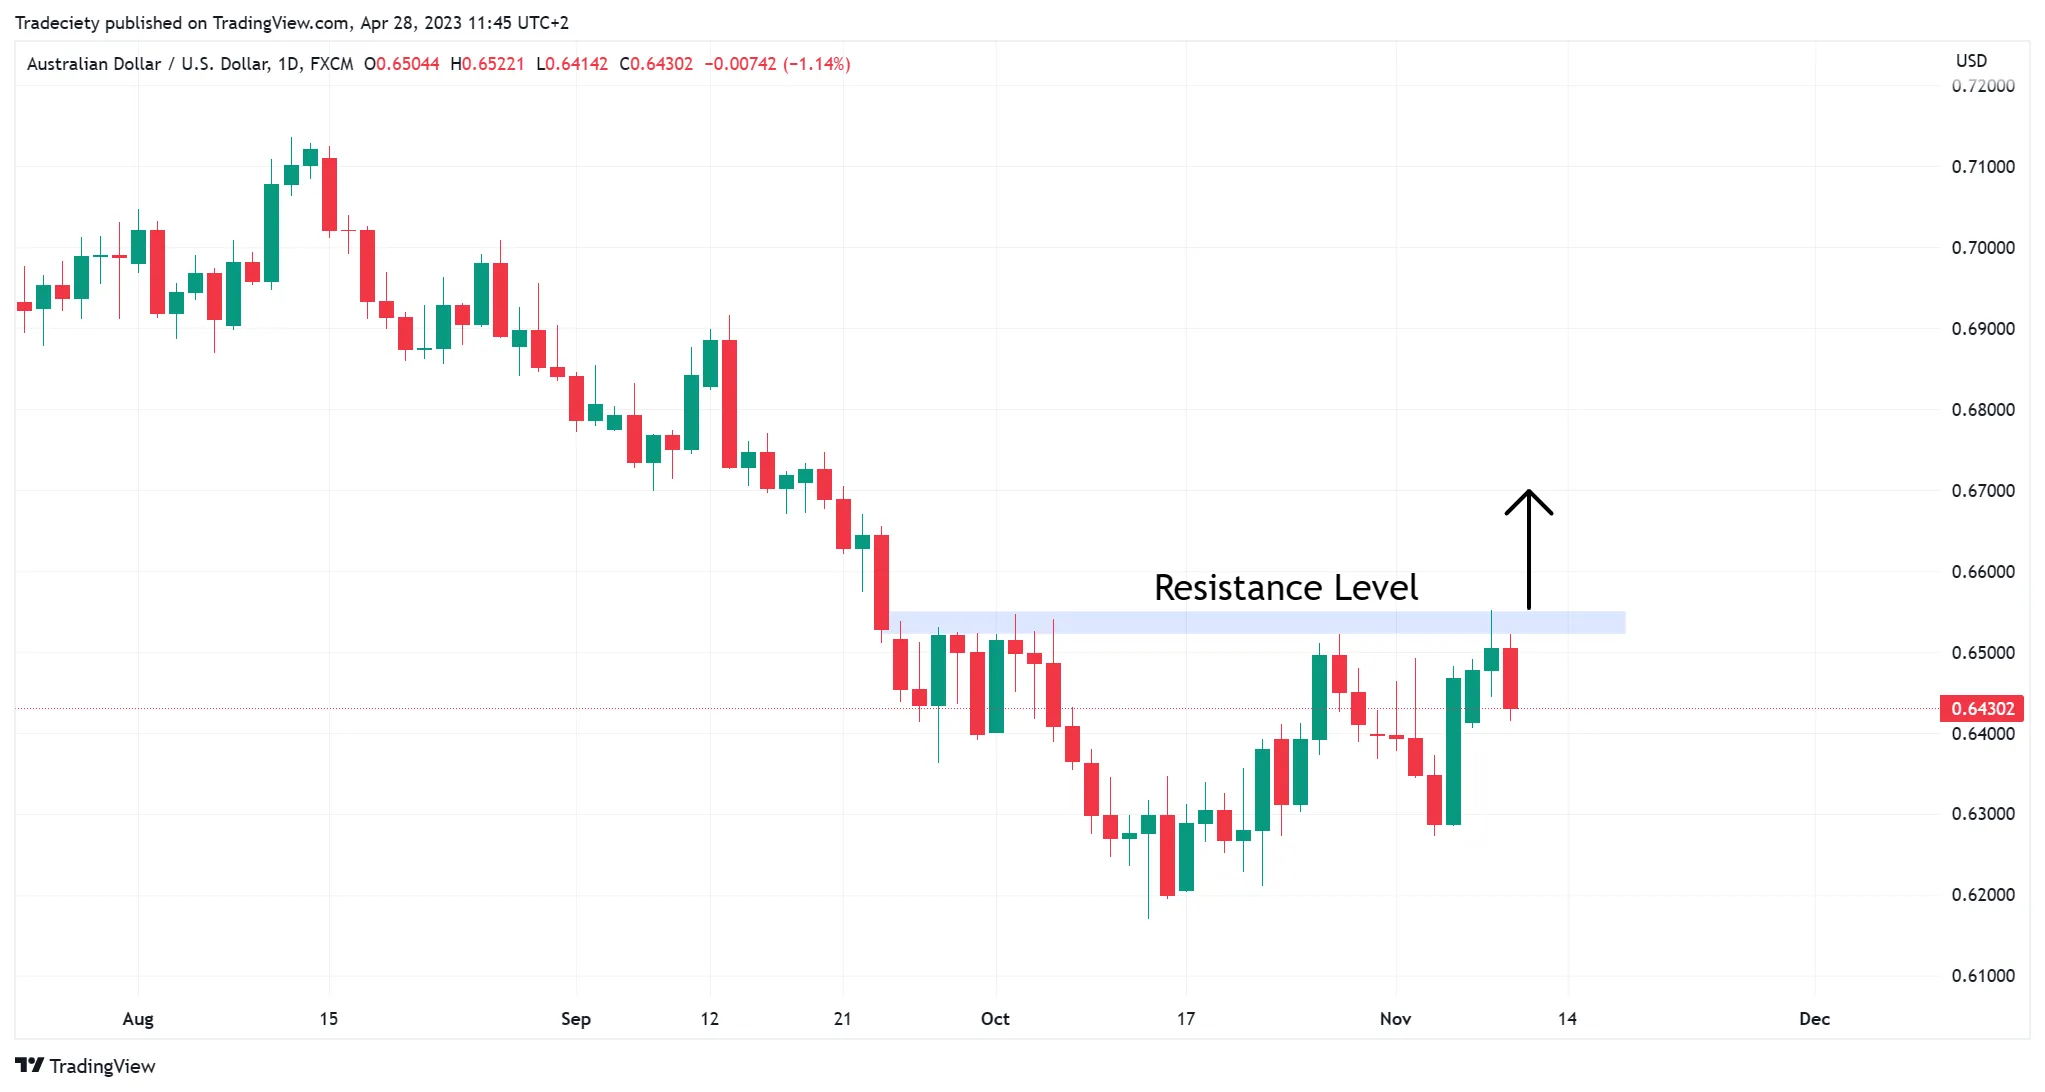
Figure 1: AUDUSD daily chart. The red horizontal line marks a strong resistance level that was tested multiple times. After price breaks sharply above it, buyers have taken control.
Once the breakout appears, drop to the 1H chart for an entry in the direction of the move. The 1H chart typically offers multiple pullbacks and trend continuations, giving trend-followers clear entry points.
Figure 2: After the breakout, the 1H chart shows multiple pullbacks and trend continuations, offering trend-followers clear entry points.
HTF support and resistance carry far more weight than LTF levels—once they break, the shift in market sentiment tends to persist for a while, which is exactly the kind of move trend-followers are looking for.
Signal 2: Trade Against the Trend After an HTF Rejection
The opposite of Signal 1. If an HTF level repeatedly stops price and shows “deceleration” signs (small bodies, long wicks, dojis), get ready to trade in the other direction. The GBPUSD 4H chart below shows a typical “running out of steam” pattern: the red resistance has been tested several times, and on the most recent attempts the candle bodies have clearly shrunk, with buyers unable to push through.
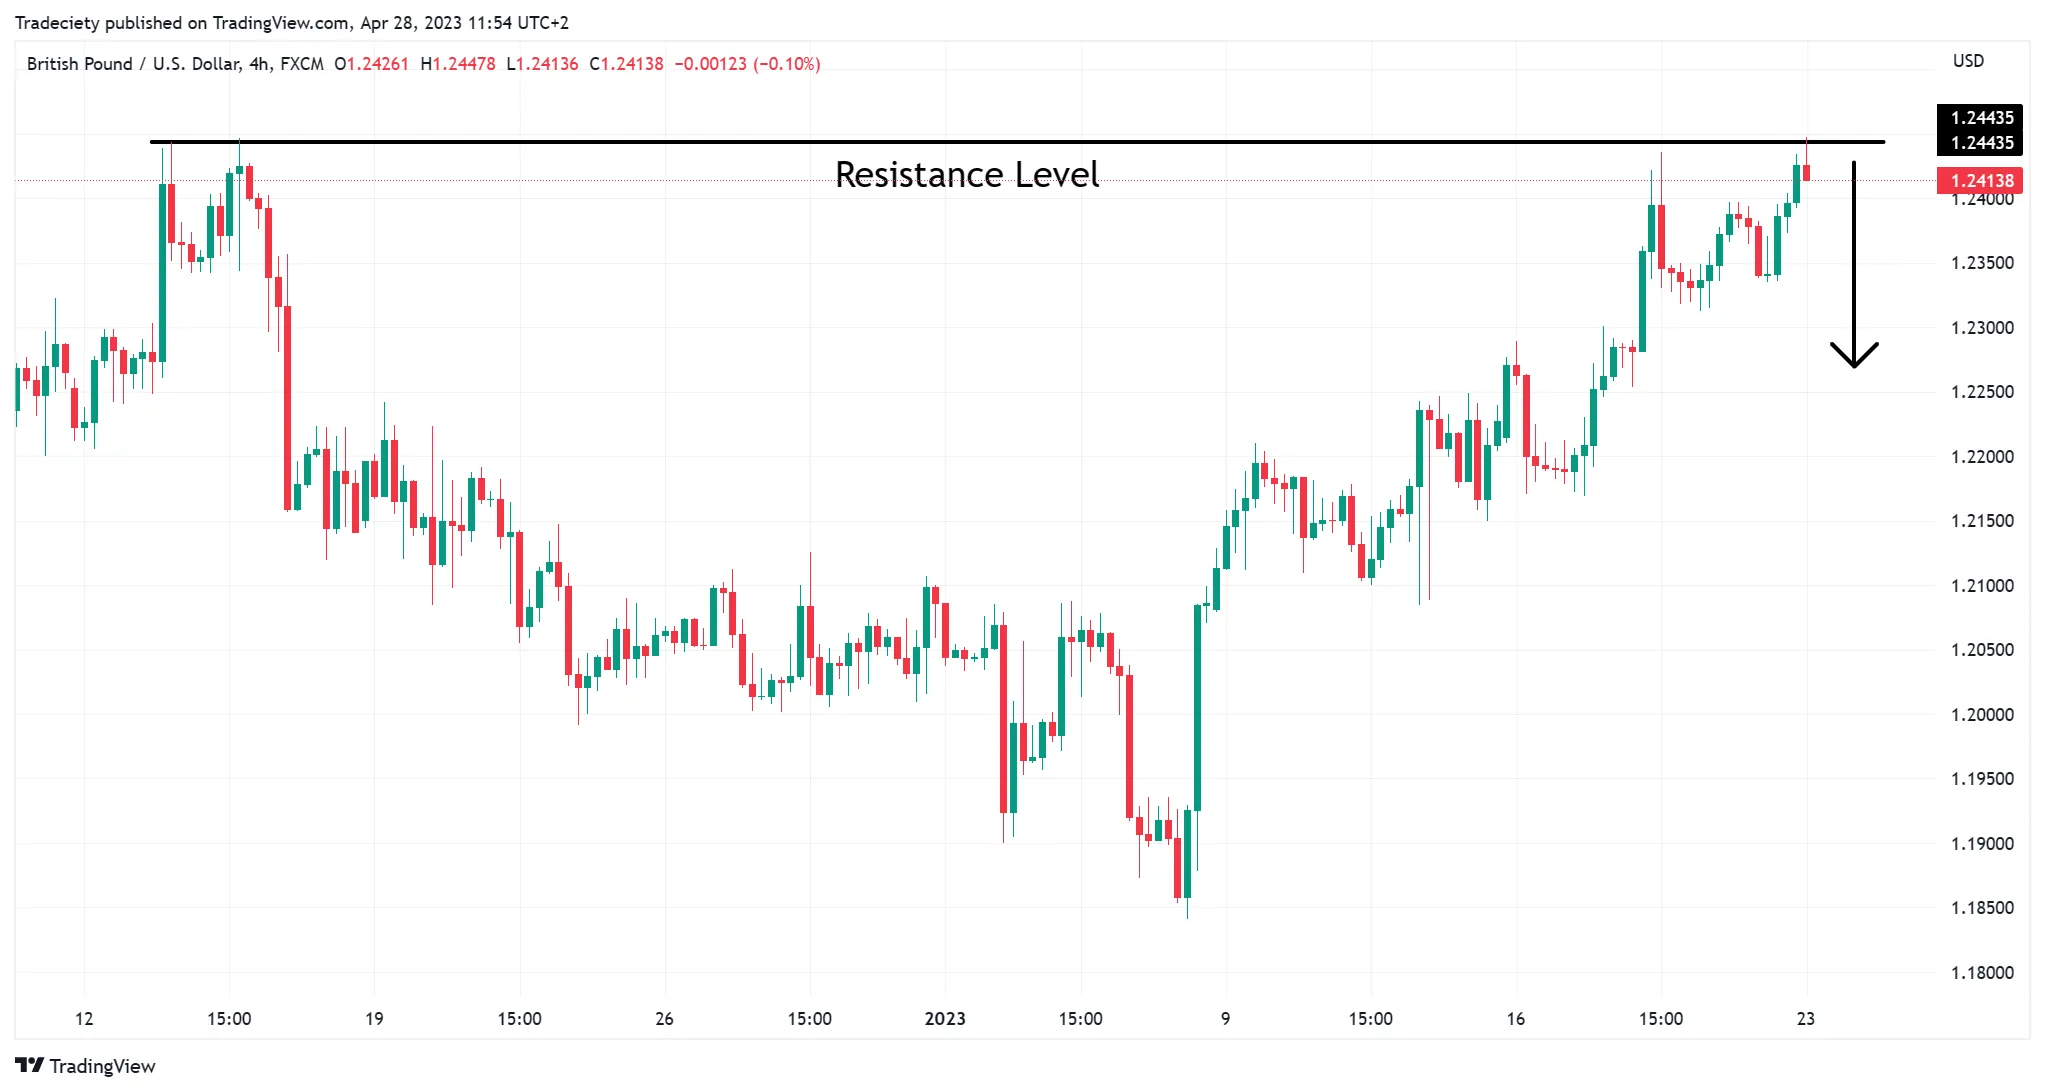
Figure 3: GBPUSD 4H chart. The red resistance level has been tested multiple times. In the most recent tests, candle bodies are clearly shrinking—showing buyers are “running out of steam.” This is a textbook “deceleration” signal.
Drop to the 15-minute chart and wait for an LTF pattern to form. Below the HTF resistance, the 15-minute chart prints a clean head and shoulders; the neckline break is the short entry.
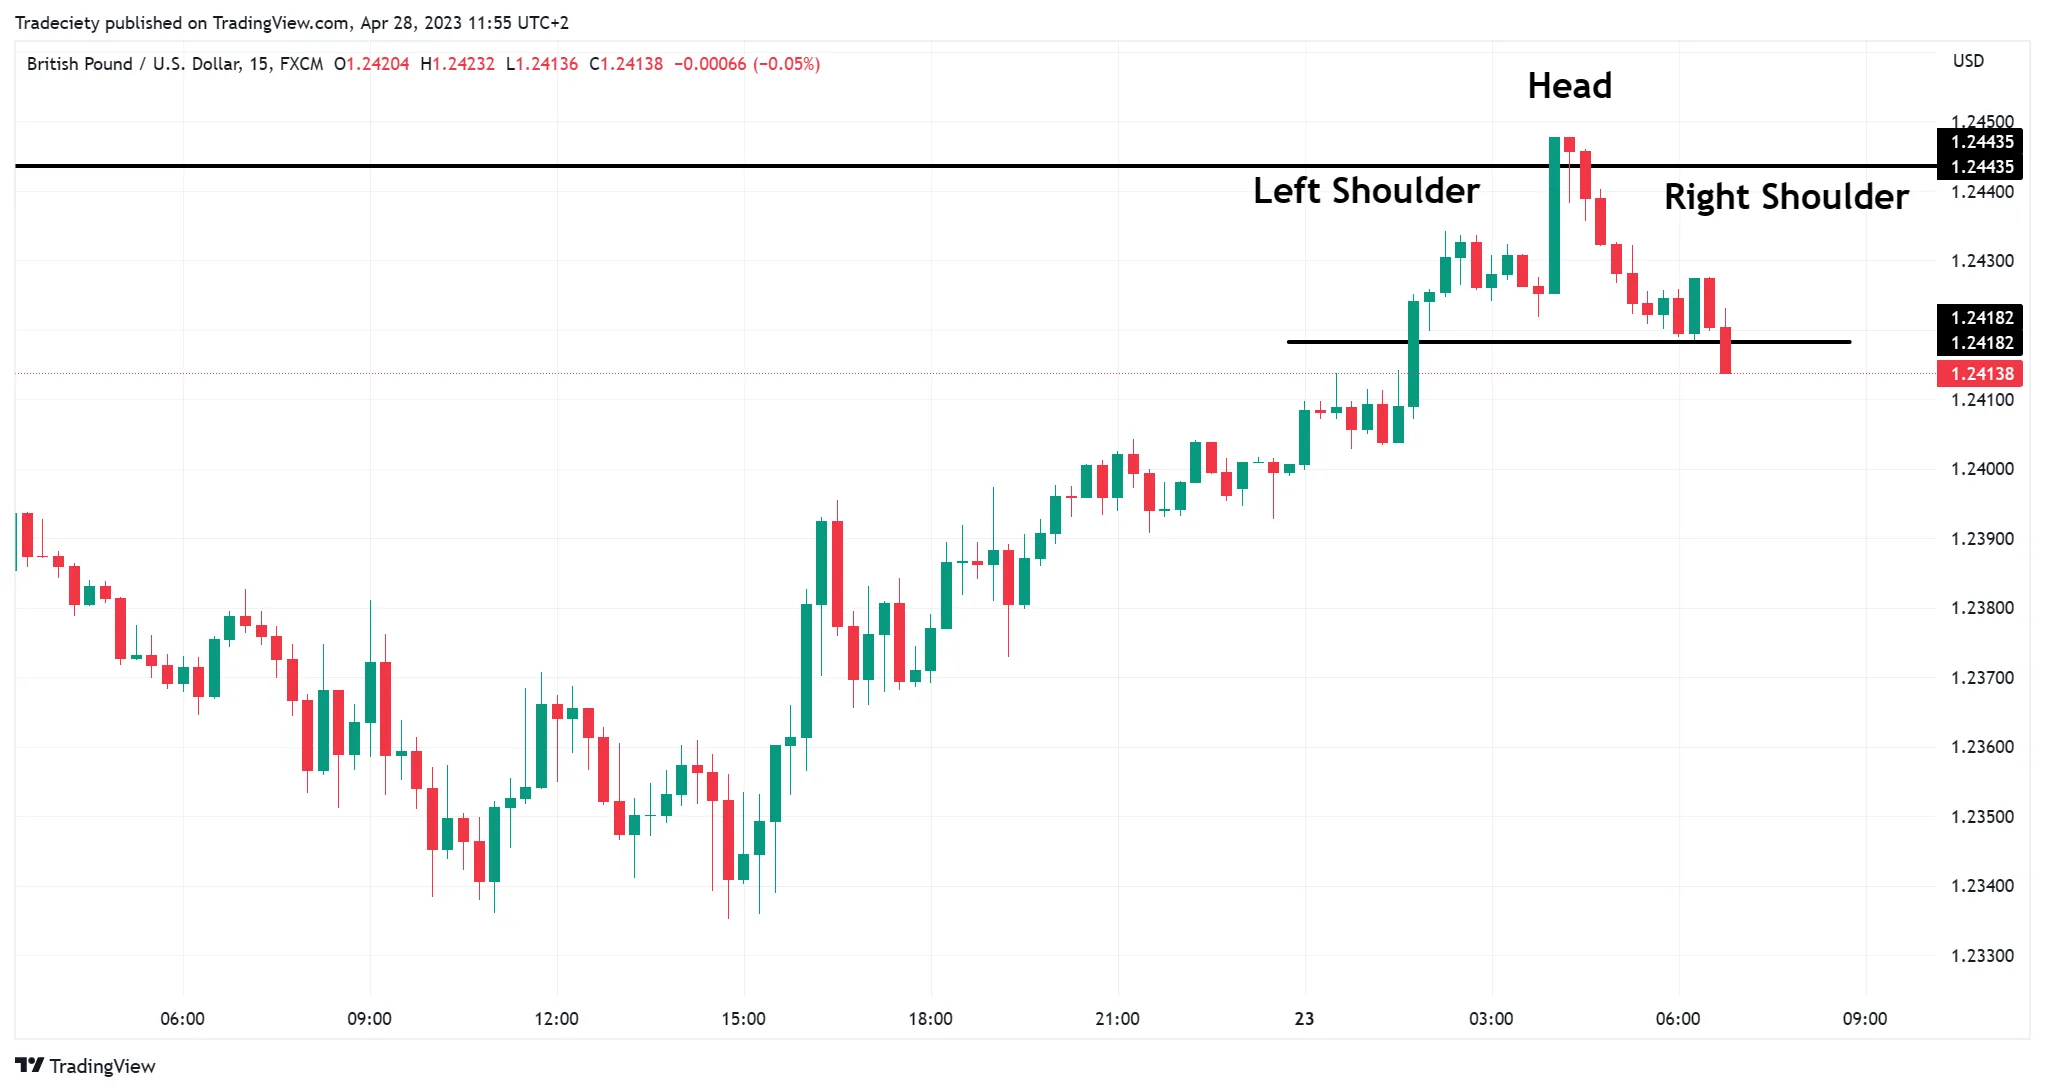
Figure 4: Below the HTF resistance, the 15-minute chart forms a clean head and shoulders pattern. The neckline break is the short entry.
After the neckline breaks, price drops sharply—longs get trapped, shorts win big. HTF bearish bias + LTF precise entry = trading with the trend.
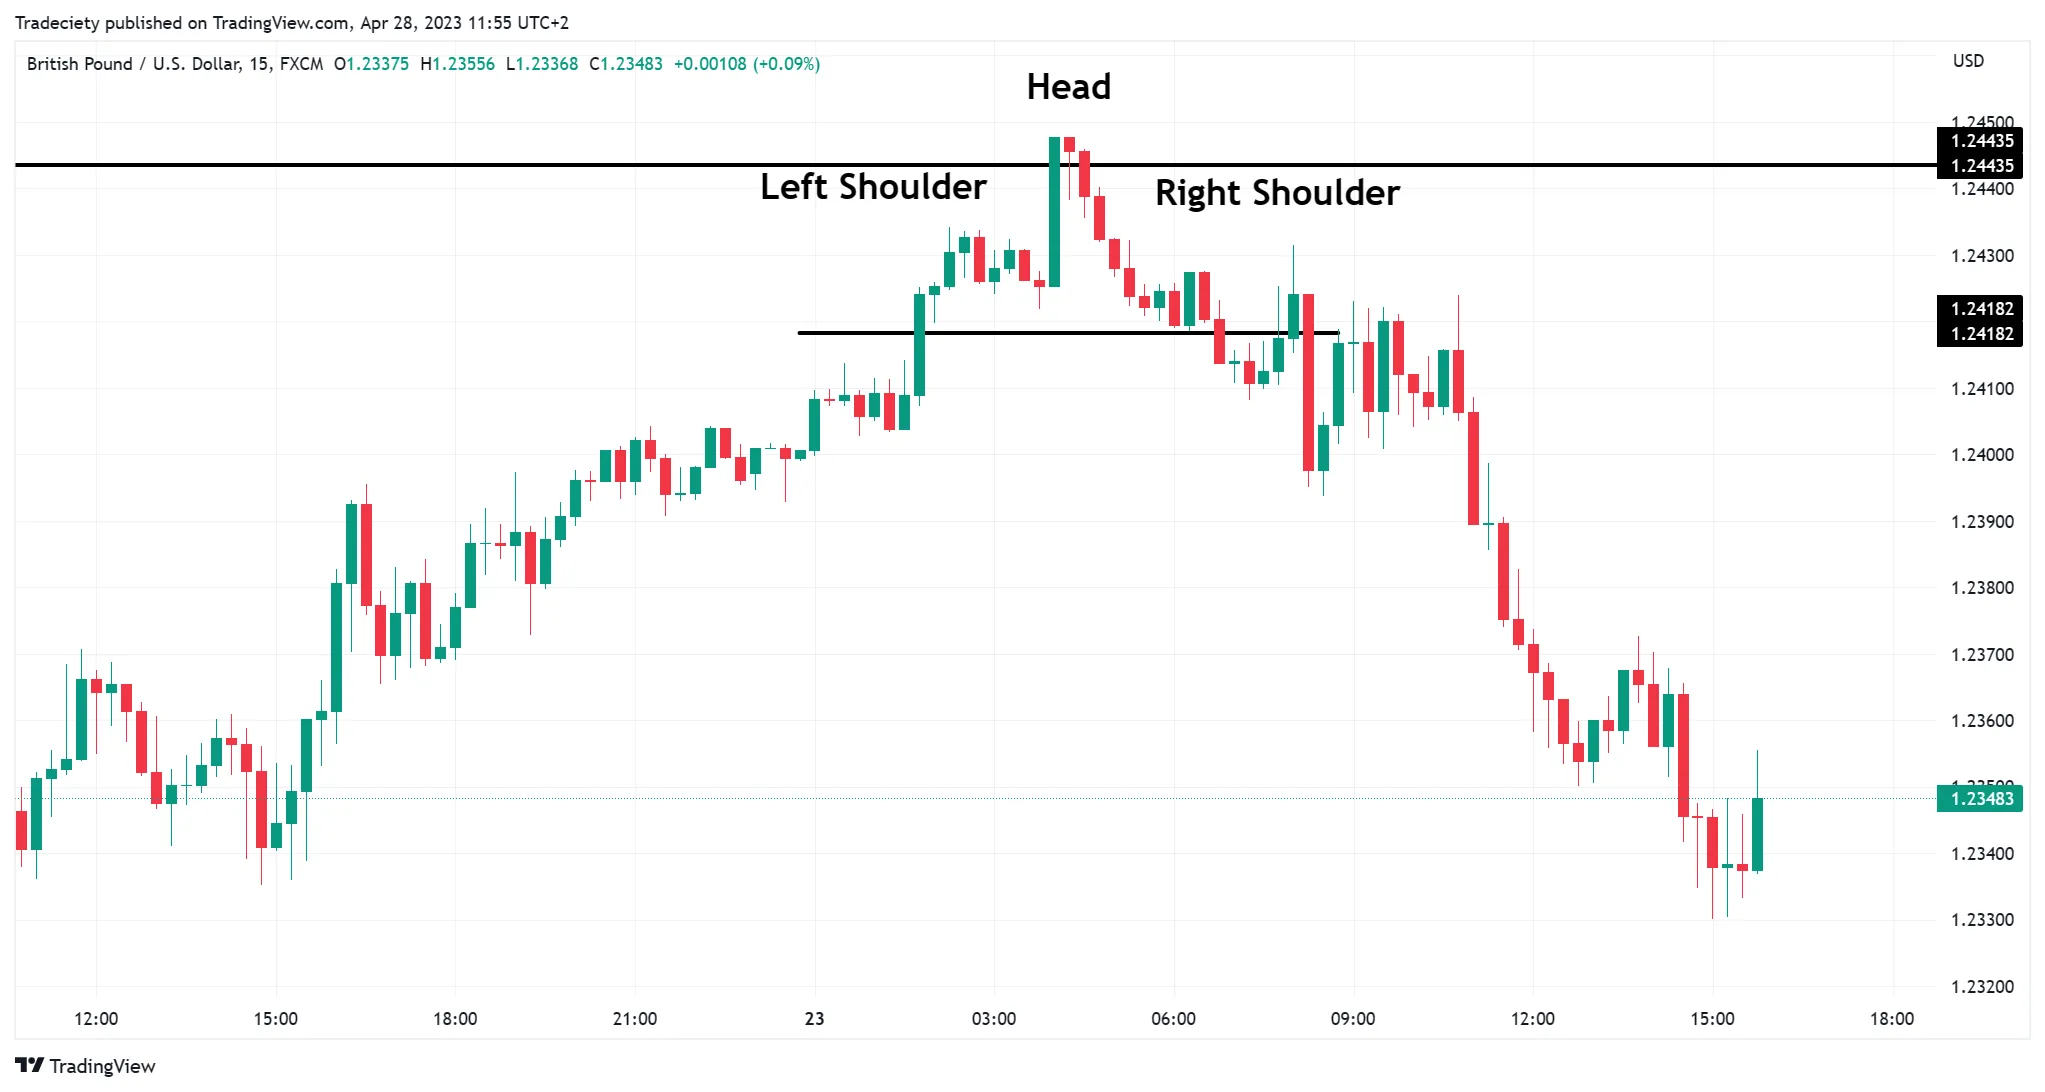
Figure 5: After the neckline break, price drops sharply. Longs get trapped, shorts win big. HTF bearish bias + LTF precise entry = trading with the trend.
The key to this signal: HTF resistance + deceleration signs = a bearish bias, and then you hunt for a concrete reversal pattern on the LTF (head and shoulders, double top, engulfing, etc.) to trigger the entry.
Signal 3: Fake Breakouts and Bull/Bear Traps on the HTF
When price briefly breaks a prior high or low and snaps right back, it’s not a simple “failed breakout”—it’s a trap deliberately set by smart money to hunt retail traders who chase the move. Spotting these “fake breakouts” is one of the highest-conviction setups in MTF, because it places “what large money actually wants” against “the retail herd’s instinct,” and price action tells you clearly which side is winning.
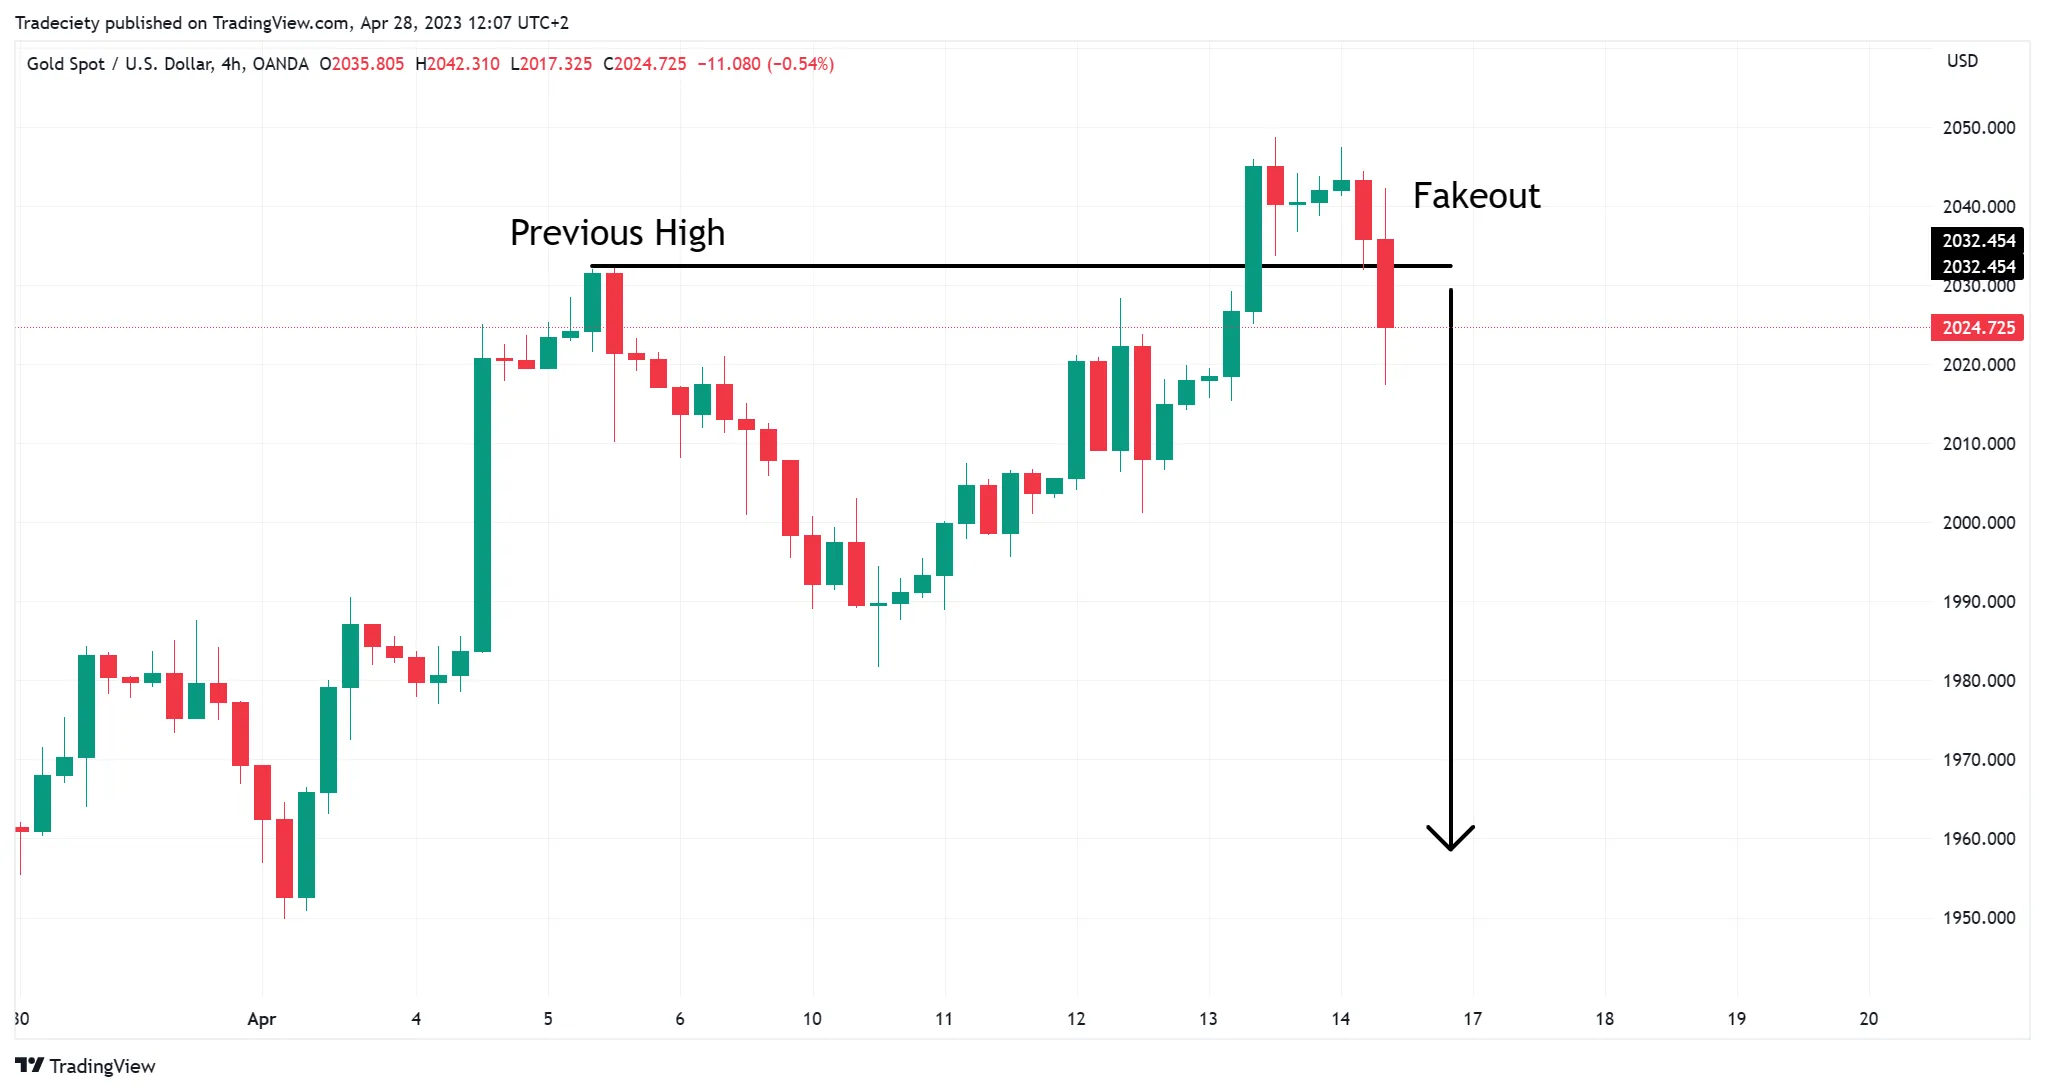
Figure 6: On the HTF, XAUUSD briefly punches above the prior high (black horizontal line) but is sold back down hard. This is a classic “Bull Trap”—the price action is telling us “someone up there wants to sell.”
Drop to the LTF and wait for a trend-continuation signal. After the fake breakout, the LTF chart forms a bearish flag; a break of the lower flag boundary is the short entry.
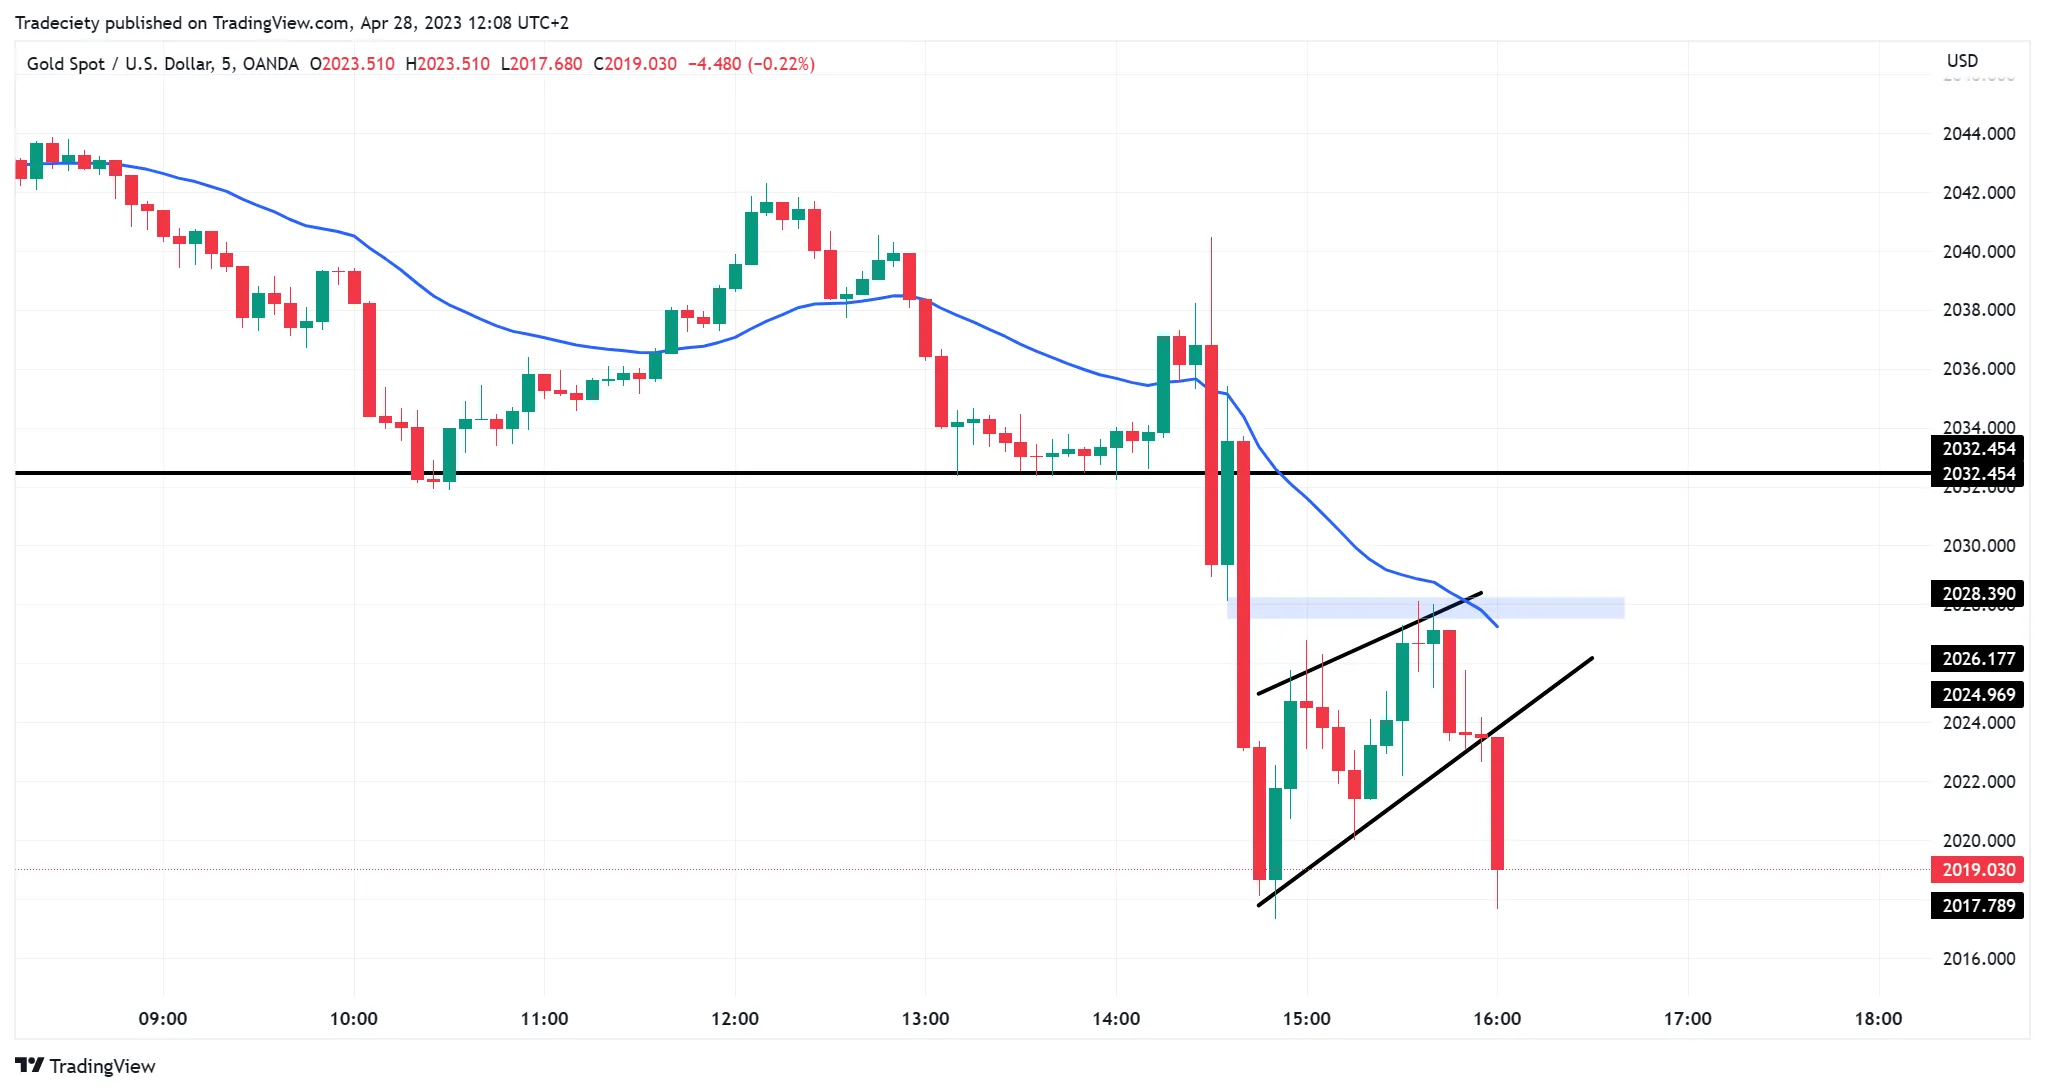
Figure 7: After the fake breakout, the LTF chart forms a bearish flag. A break of the lower flag boundary is the short entry.
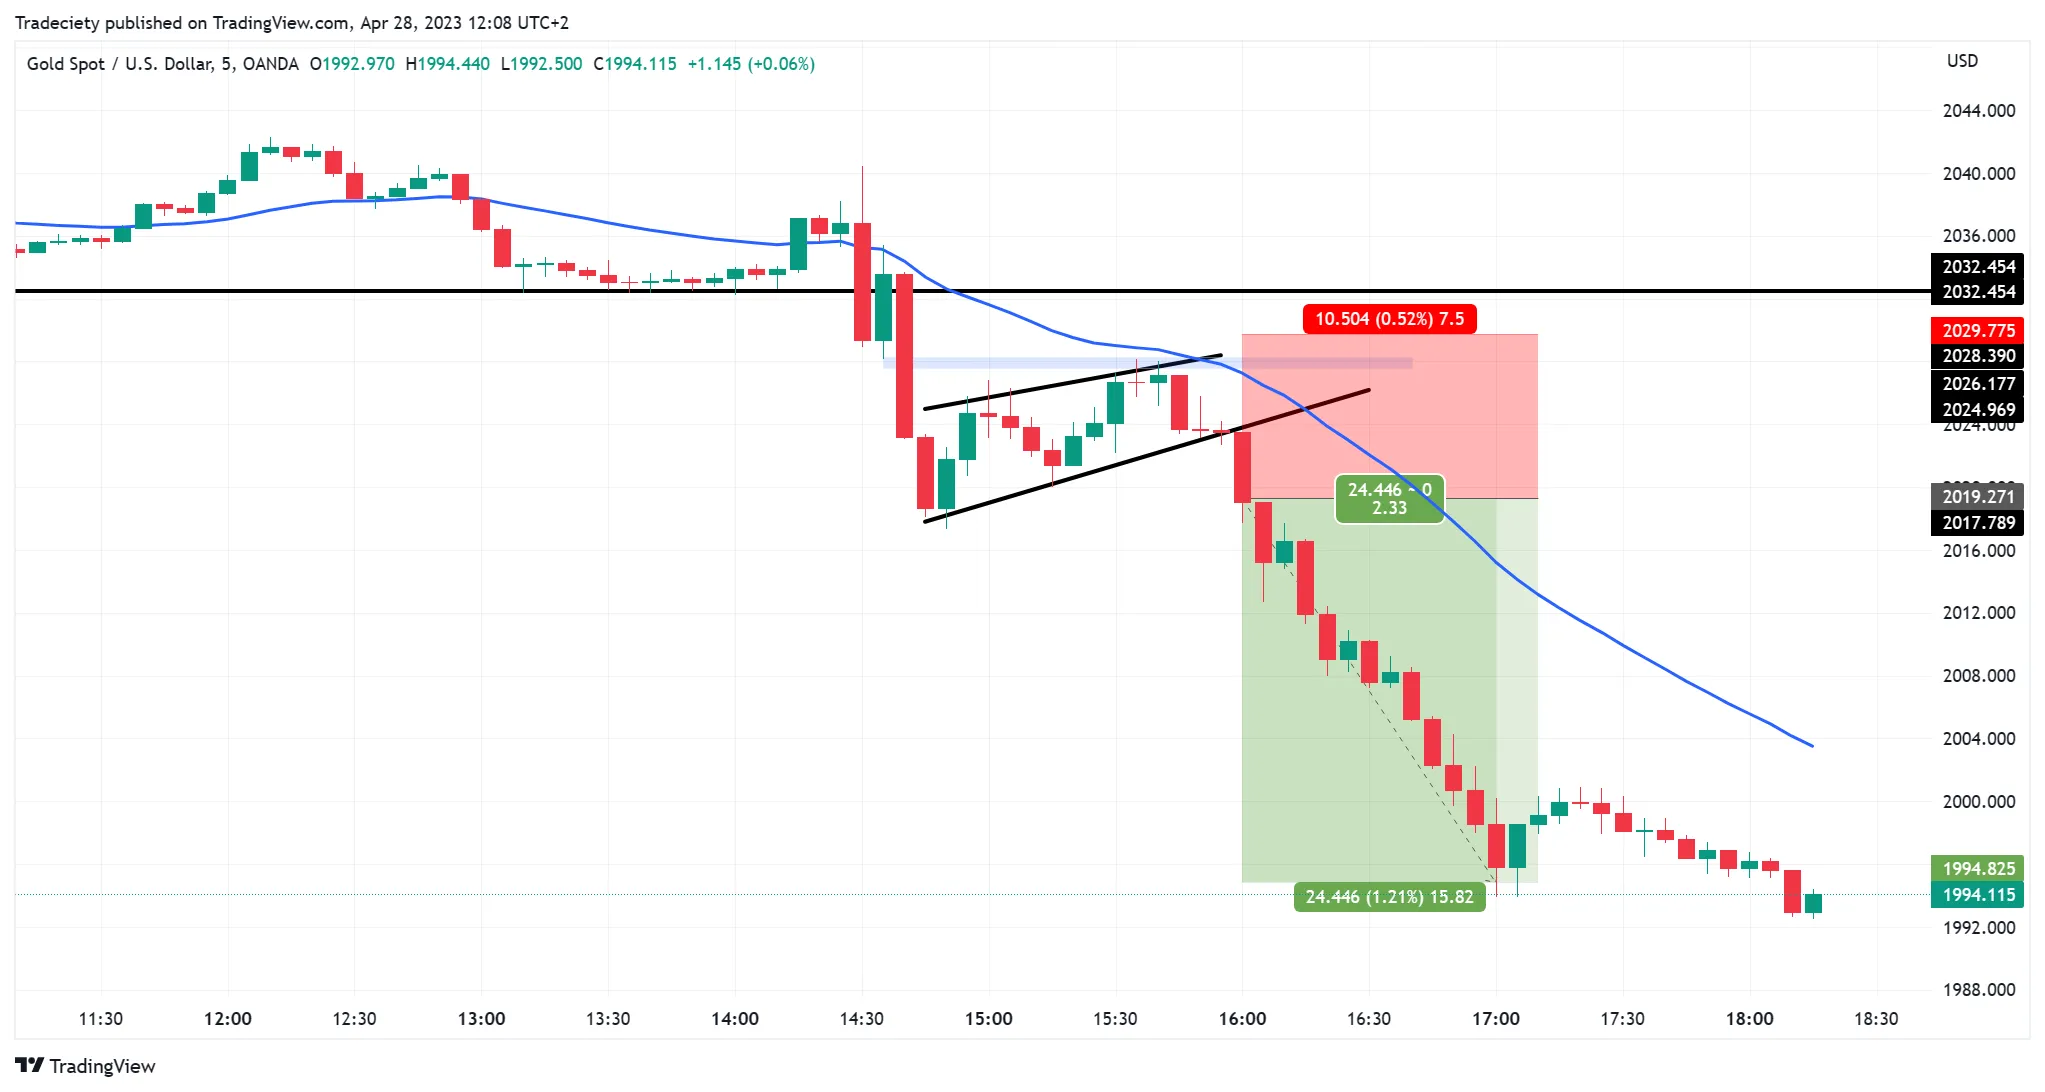
Figure 8: The selloff accelerates after the flag break. HTF trap signal + LTF trend pattern = a clean trend-short setup.
Why this signal deserves its own section: trading the HTF fakeout directly means a holding period that can stretch from days to weeks, exposing you to overnight risk and news shocks. Using an LTF entry shortens the holding time—you still capture the main wave of the HTF move, but your time in the trade can be cut in half or more. For most part-time traders, turning “must hold for weeks” into “hold for two or three days” is a qualitative change.
Signal 4: HTF Candle Patterns in the Context of Trend
A single candle in isolation is meaningless, but when it appears at a key pullback level within a trend, the signal strength multiplies. The EURUSD daily chart below shows a bullish engulfing—a large bullish candle completely engulfs the prior small bearish candle. Three factors stack up: ① an overall uptrend, ② price sitting near the 30-period EMA, ③ the engulfing pattern itself.
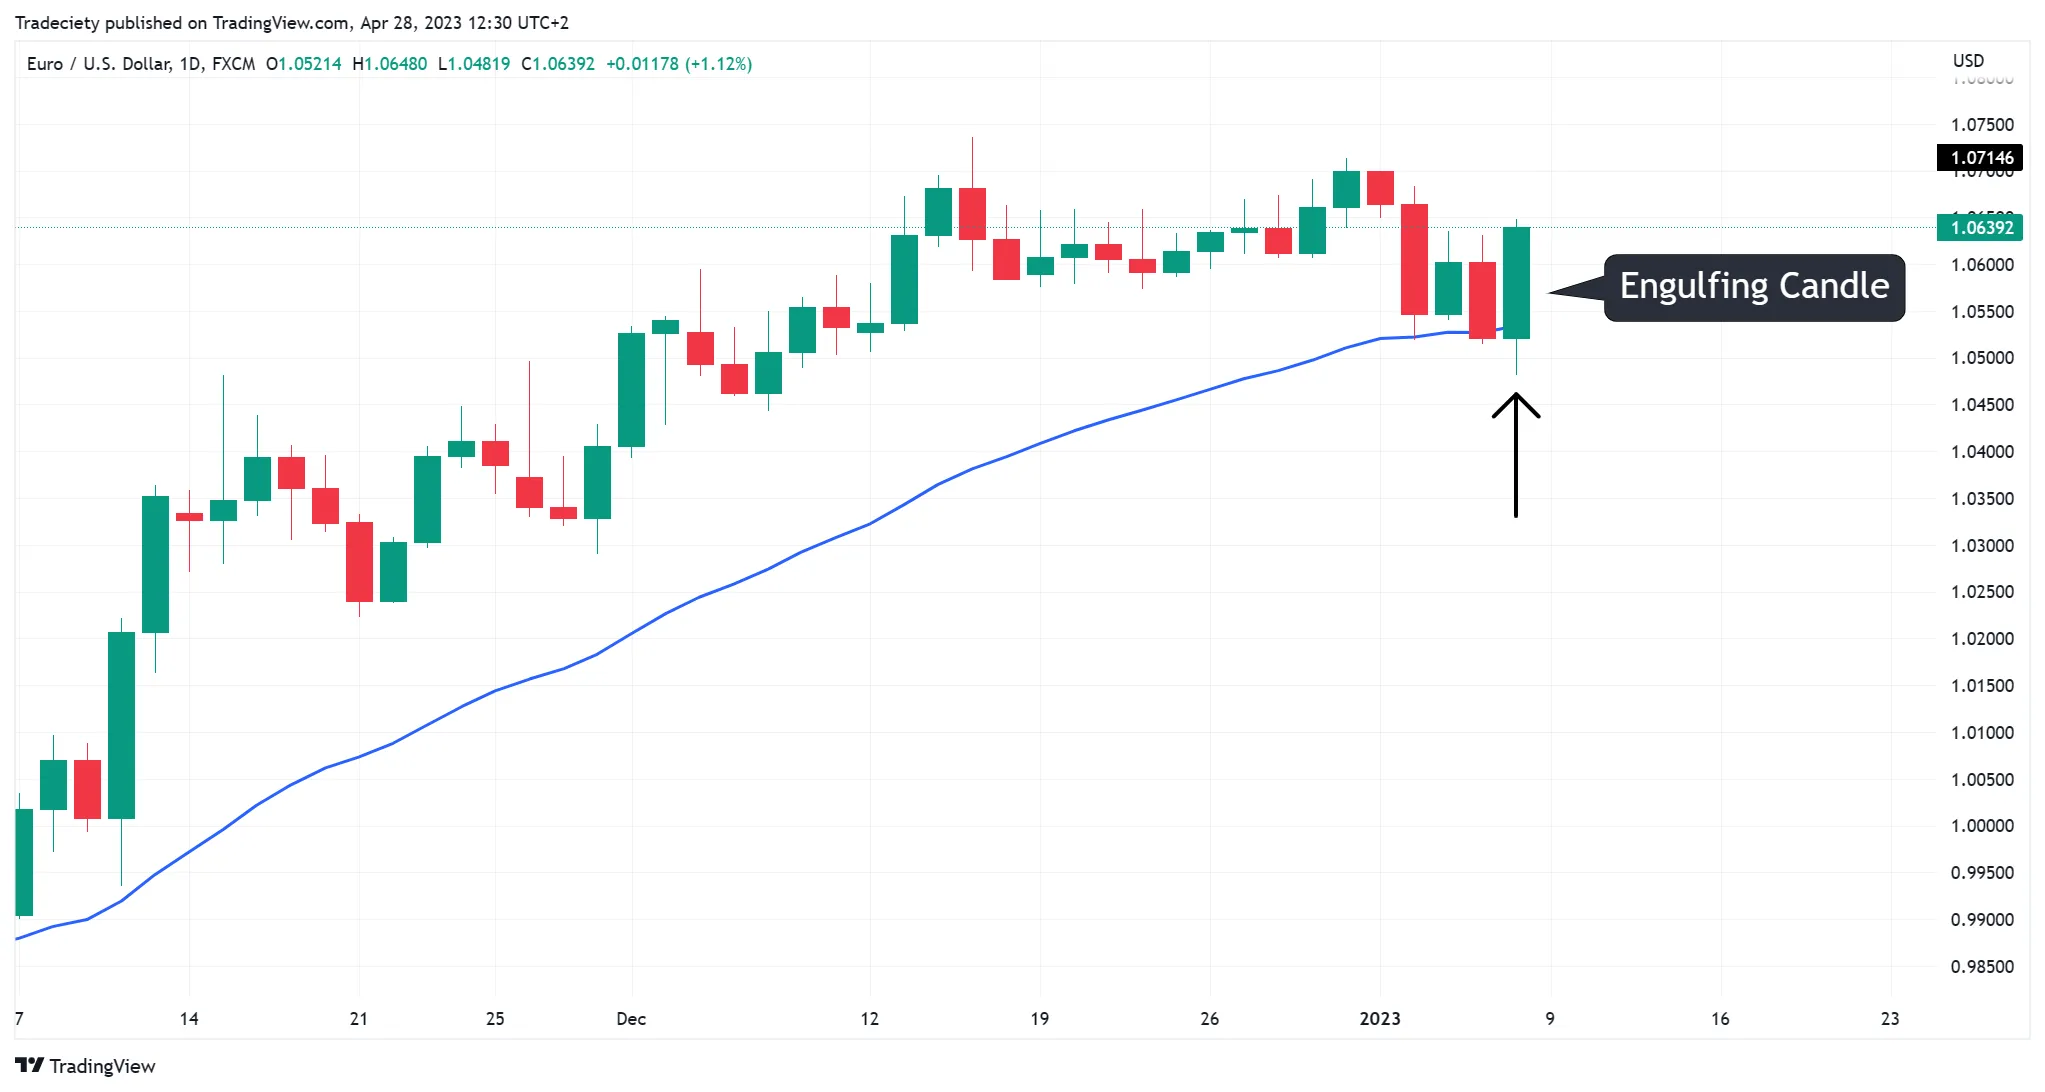
Figure 9: On the EURUSD daily chart, a bullish engulfing pattern forms—a large bullish candle completely engulfs the prior small bearish candle. Three factors stack up: ① overall uptrend, ② near the 30-period EMA, ③ the engulfing pattern itself.
Drop to the 5-minute chart for a precise entry. After the high of the engulfing candle is broken (left blue zone), price rallies quickly. Trend-followers enter on that breakout and enjoy the sweet spot of “small stop, big move.”
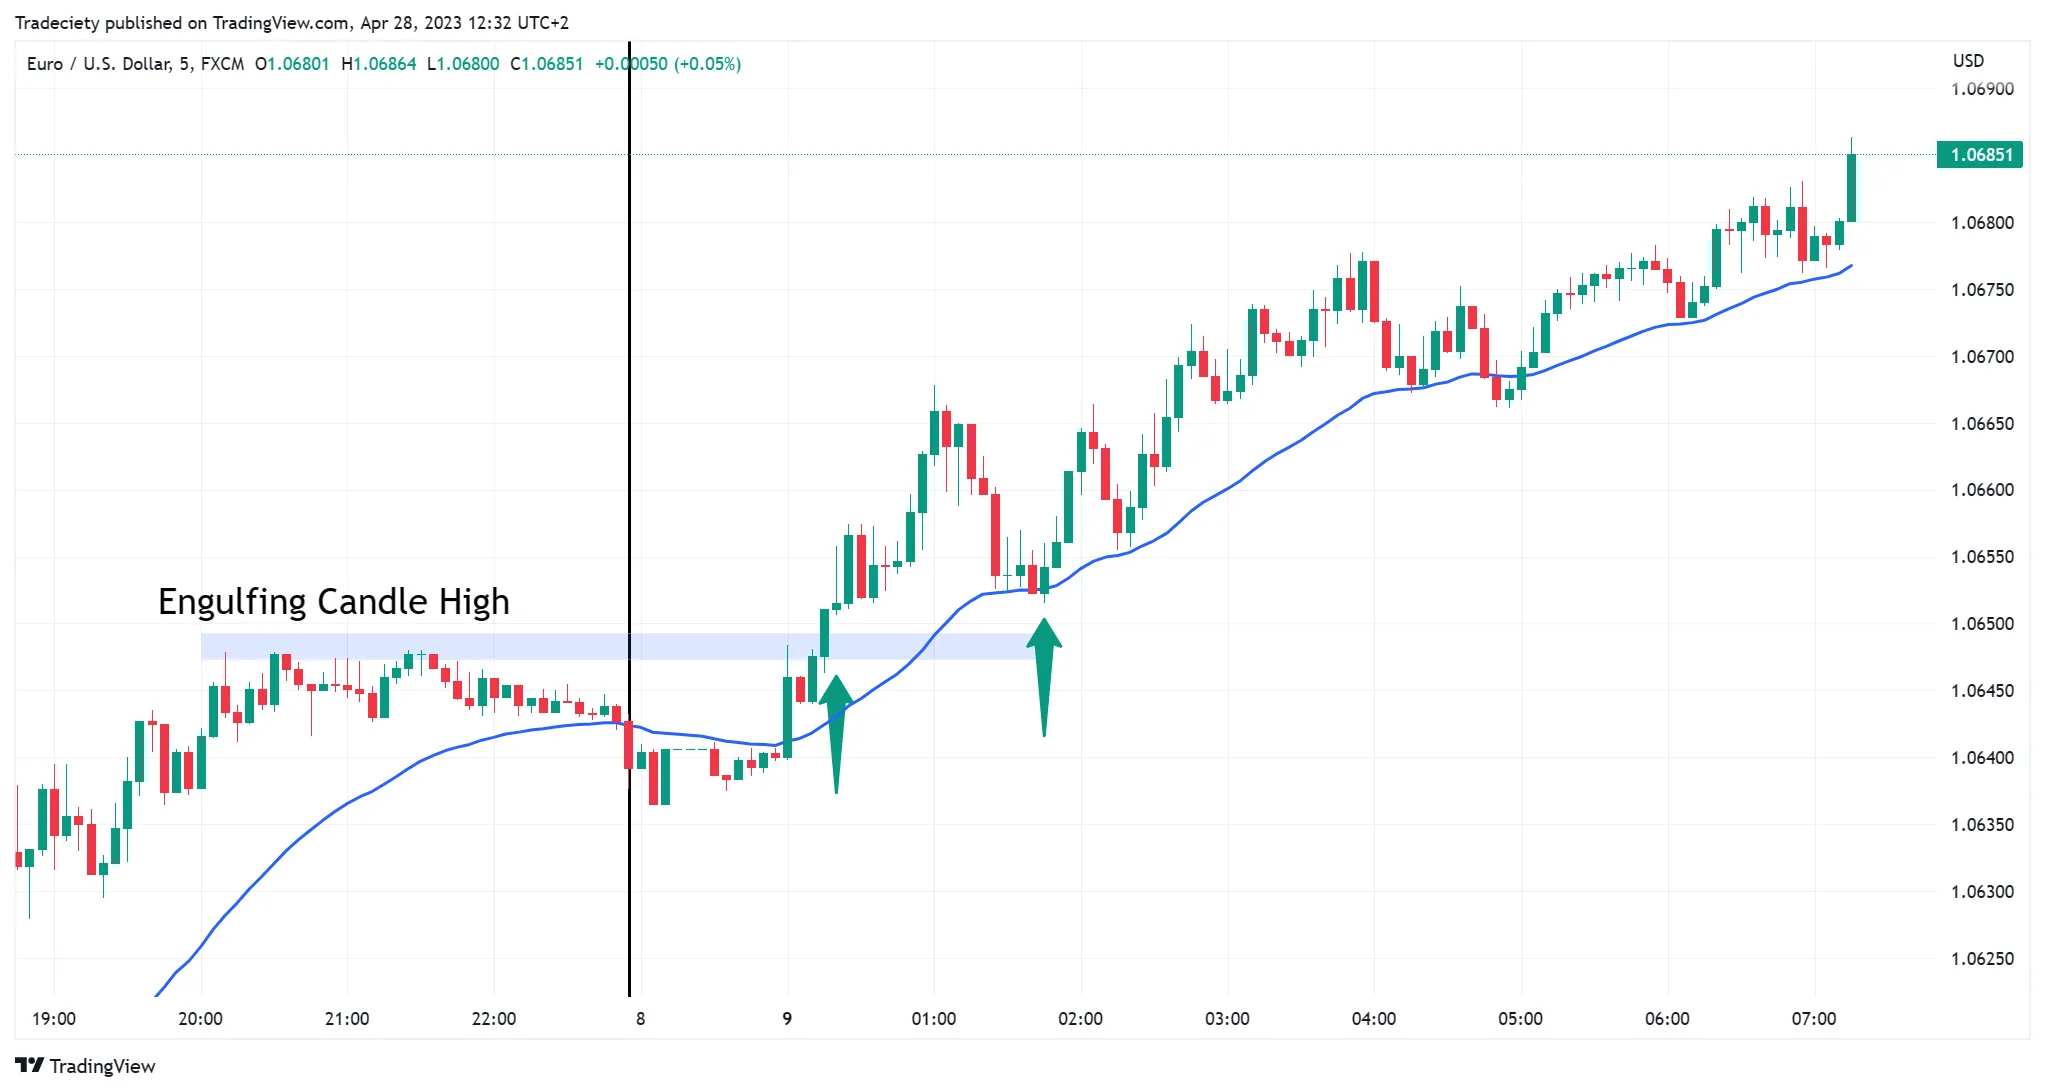
Figure 10: After the high of the engulfing candle is broken (left blue zone), price rallies quickly. Trend followers enter on that breakout, enjoying the sweet spot of “small stop, big move.”
The HTF engulfing tells you the direction. The LTF breakout tells you when to enter.
Signal 5: HTF Chart Patterns Combined With LTF Entries
Complex HTF patterns (flags, triangles, double tops/bottoms) give you a robust directional bias, while simple LTF patterns (ranges, triangles, breakouts) give you the precise entry trigger. The NZDUSD 4H chart below shows a bearish flag (descending channel) forming inside an overall downtrend. After breaking the lower flag boundary, price pulls back to retest the trendline and prints a bearish candle signal—a standard “flag + retest” short setup.
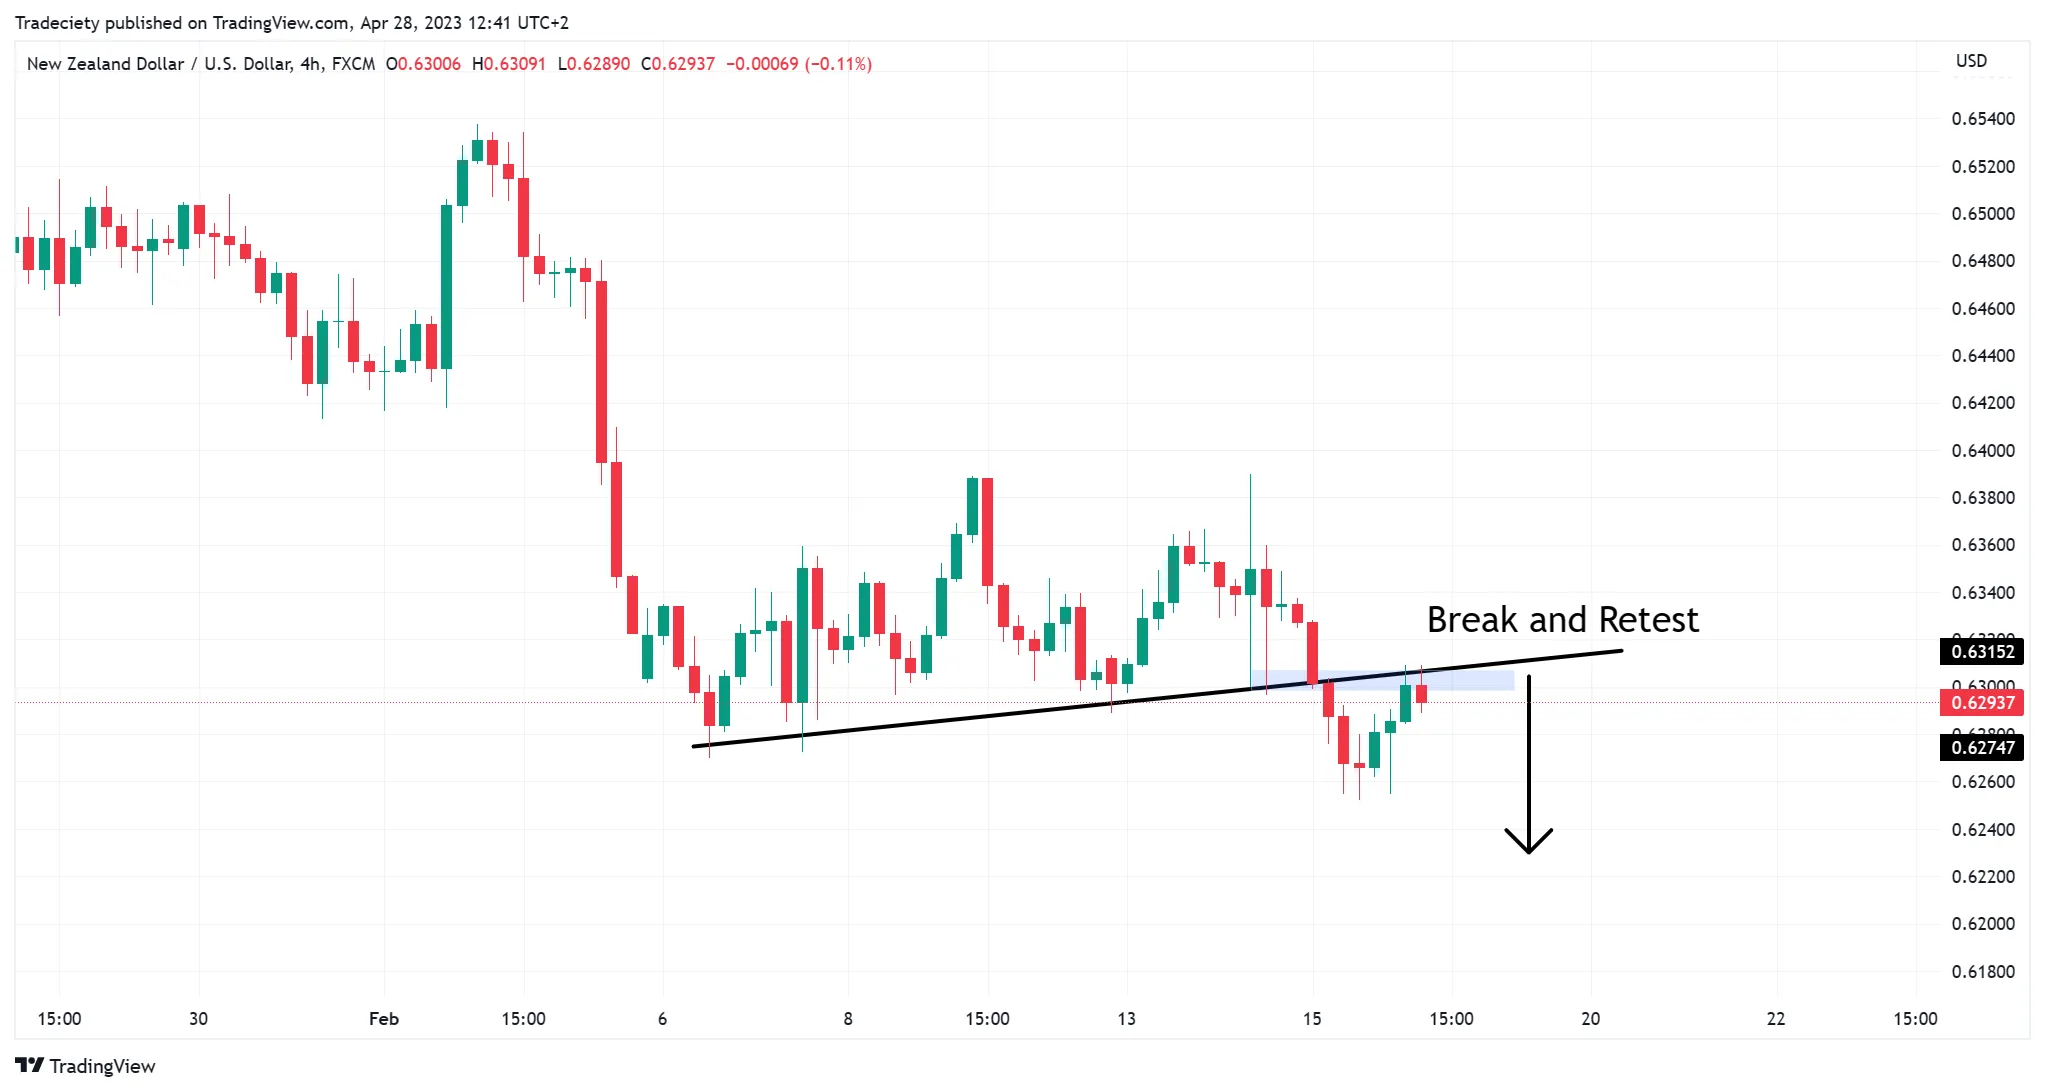
Figure 11: NZDUSD 4H chart, overall downtrend, price forms a bearish flag (descending channel). After breaking the lower flag boundary, price pulls back to retest the trendline and prints a bearish candle signal—a standard “flag + retest” short setup.
Drop to the 5-minute chart: a triple top range is forming, and the neckline break is the precise short trigger.
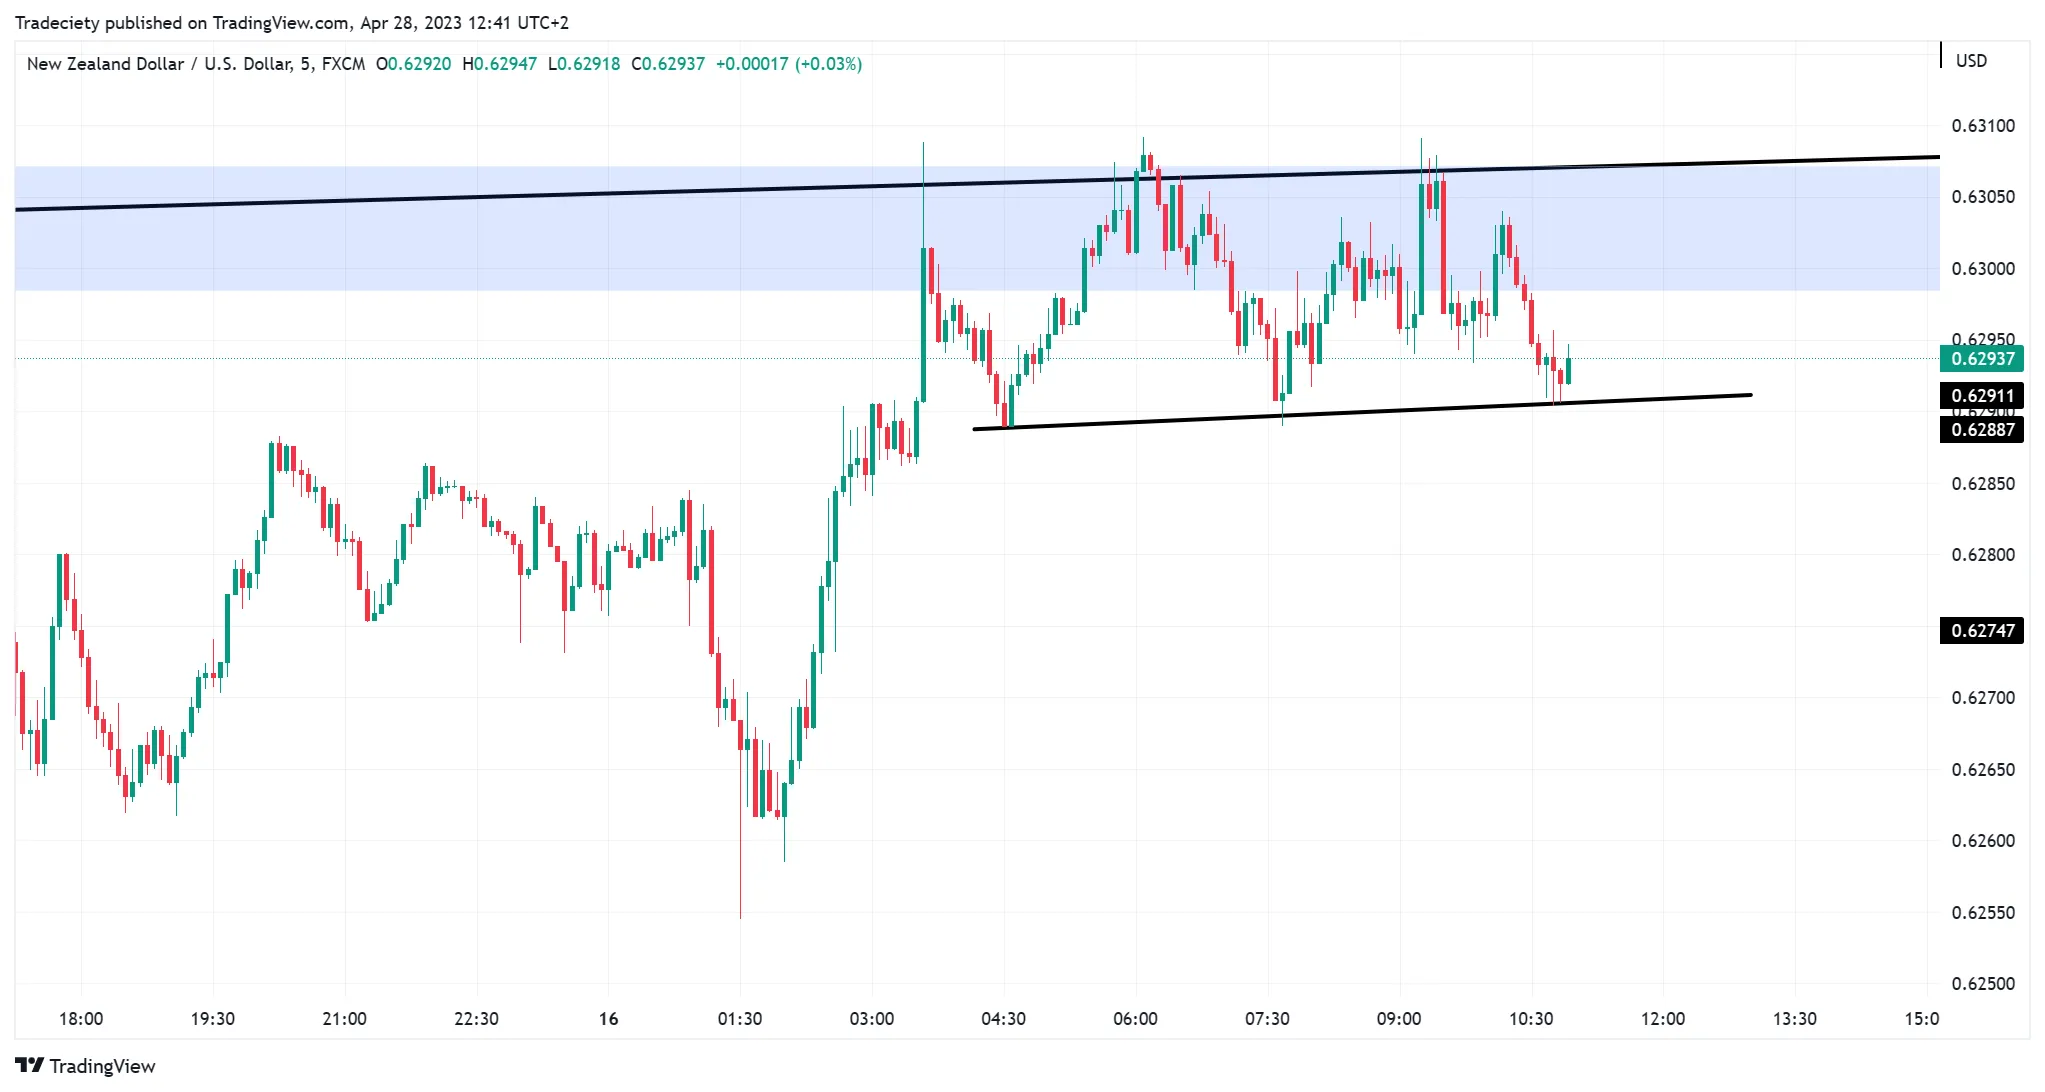
Figure 12: The 5-minute chart shows a triple top range forming. Wait for the neckline break—that is the precise short trigger.
After the neckline breaks, price drops fast. HTF trend + flag + LTF range break = a precise entry in the direction of the trend.
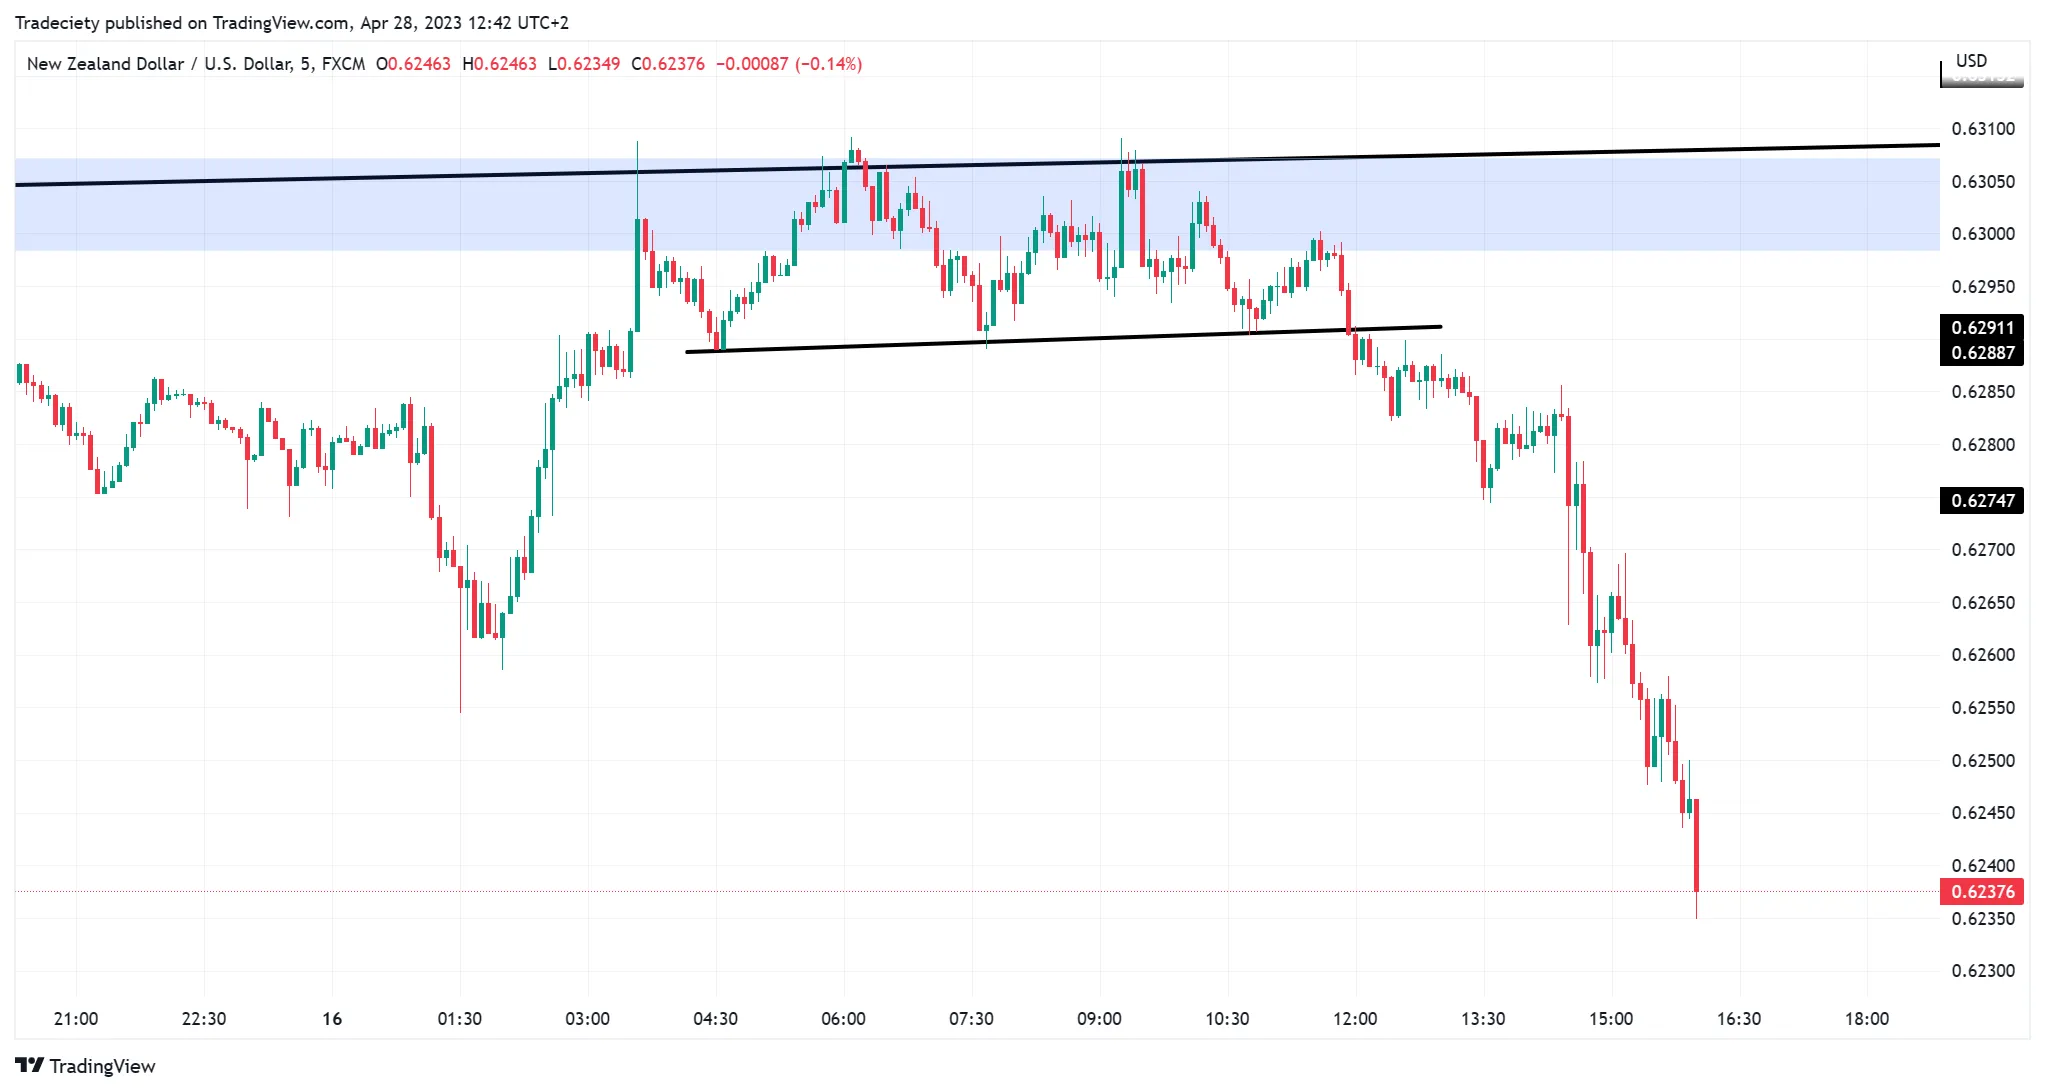
Figure 13: After the neckline break, price drops fast. HTF trend + flag + LTF range break = a precise entry in the direction of the trend.
The reason this combination works: the HTF keeps you trading with the trend (you won’t be on the wrong side of the big move), and the LTF gives you a precise entry with a small stop and a strong risk-reward. Many traders lose money not because they got the direction wrong, but because their entry was so sloppy that a small pullback stopped them out—even when the move eventually played out as expected. The LTF’s precise entry exists to fix exactly that.
Don’t Greed for More: Pick One Setup and Stick With It
After reading this far you might be wondering whether you should use all five signals at once. No—and this is the trap beginners most often fall into. The right approach is to pick 1–2 signals that suit your personality, run them on a demo or small live account under the same rules for at least 30 trades, log every result, and only then evaluate your win rate, risk-reward, and max drawdown before deciding to continue or adjust.
“System hopping” is one of the most common killers of traders. Today Strategy 1, tomorrow Strategy 3, the day after that Strategy 4 looks cooler—and in the end, you’ve learned nothing. Every strategy, given a large enough sample, has its own distribution of win rates and risk-reward; the question is whether you can let that distribution play out under a single set of rules. Comparing strategies without sample size is meaningless—judging a strategy “broken” after 10 trades often just means those 10 trades happened to land in unfavorable market conditions.
Four Practical Tips That Are Easy to Overlook
First, set a fixed schedule for chart analysis. If you’ve picked 4H as your HTF, set an alarm for the close of every 4H candle and scan your markets, refresh your indicators, and mark HTF signals at the same time each day. Don’t “glance at the chart whenever you happen to think of it”—fragmented analysis misses the signals that matter. A fixed schedule has another benefit: it builds rhythm. You enter the same analytical state at the same time each day, which is far more focused than opening charts at random moments.
Second, accept a “no-bias” state. Not every day offers a clear bullish or bearish opportunity. When the HTF cannot form a clear bias, the best trade is no trade at all—wait for the cleanest chart context, then pull the trigger. Not trading is also a form of trading. Most traders lose money not because they “got it wrong,” but because they “did too much”—putting capital into structureless conditions, where even a good strategy gets chewed up by noise.
Third, more timeframes is not better. Two timeframes is enough. Three or four actually causes signal overload—HTF bullish, MTF neutral, LTF bearish—so who do you listen to? The answer is the HTF. The LTF is in charge of “timing,” not “direction.” Once you start wavering on “direction” between different timeframes, analysis itself becomes a source of anxiety rather than a decision tool.
Fourth, embed risk control into every timeframe layer. The HTF decides direction and target levels (how far the trend can go); the LTF decides entry point and stop-loss (the optimal risk location). This way, every trade carries both an HTF “story” and an LTF “detail,” and both your win rate and risk-reward tend to be better.
Closing Thought: MTF Is a Habit
By the time you reach this point, you should have grasped one thing: multi-timeframe analysis isn’t a technique, it’s a habit.
A trader watching a single timeframe sees “what price is at this moment.” Add a higher timeframe and you see “where price currently sits in the larger picture.” The first type of trader trades on reaction; the second trades on judgment. Over the long run, the gap is obvious.
Patience + consistency—these are the two things through which MTF can truly change your trading results. Pick your combination, stick with it, and after 30 trades, you’ll have a fundamentally different understanding.
Appendix: Quick-Reference Cheat Sheet
| Concept | Detail |
|---|---|
| What MTF is | HTF for direction, LTF for timing |
| Order of analysis | Top-down: HTF first, then LTF |
| Timeframe choice | Pick a setup and stick with it for 30–50 trades |
| HTF signal types | Key-level breakouts, rejections, fake breakouts, candle patterns, chart patterns |
| LTF role | Provide precise entries and shorten holding time |
| Risk control | HTF sets targets, LTF sets stops |
| Mindset | Accept the “no-bias” state; better to sit out |
If you’ve been struggling with “staring at the screen all day and still not making money,” this playbook aims to help you pull your view back out of a single candle and into the market as a whole. Pick your combination, run it for 30 trades, then judge.